```html
The Critical Role of Fluid Compatibility in Industrial Safety

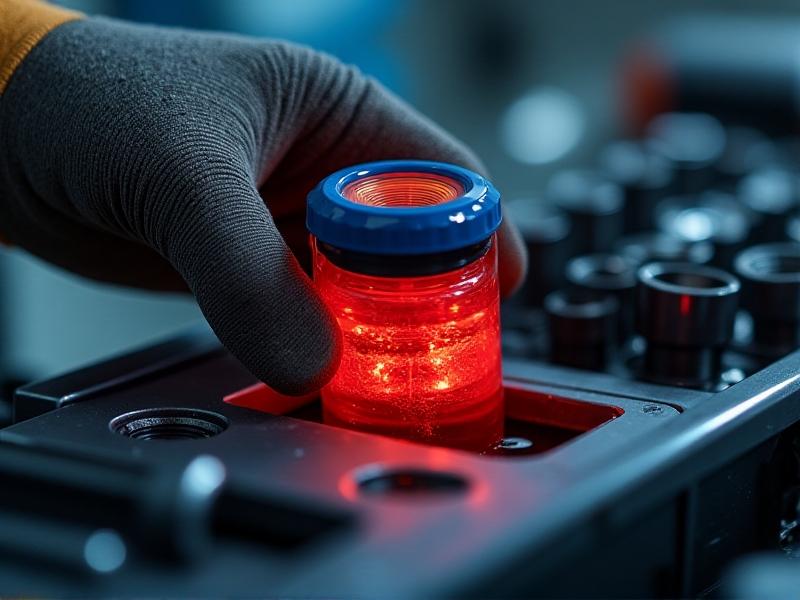
Fluid compatibility is the backbone of operational safety in industries ranging from pharmaceuticals to oil refining. Mixing incompatible chemicals can trigger explosions, toxic gas releases, or equipment corrosion—risks that endanger lives and incur multimillion-dollar losses. For example, combining acidic fluids with alkaline substances in a cooling system might neutralize pH levels temporarily but create precipitates that clog machinery over time. A well-designed fluid compatibility chart acts as a preventive blueprint, guiding teams on which substances can coexist safely. These charts aren’t just for chemists; plant managers, engineers, and even logistics teams rely on them daily. By mapping chemical interactions visually, they turn complex reactivity data into actionable insights, ensuring every decision aligns with safety standards.
Understanding Fluid Compatibility Charts: A Primer
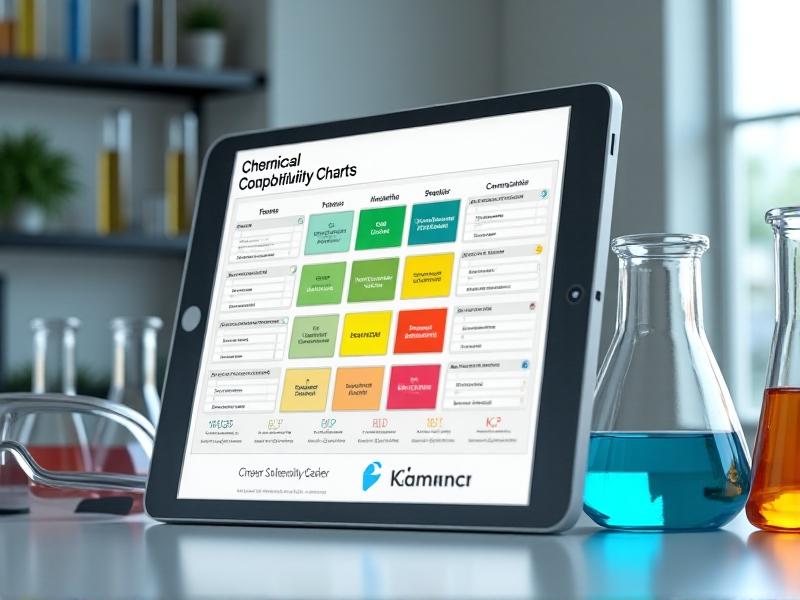
A fluid compatibility chart is a matrix that cross-references chemicals to identify safe or hazardous combinations. Each row and column represents a specific fluid, with cells color-coded to indicate risk levels—green for safe, yellow for conditional use, and red for prohibited mixtures. These charts often include footnotes explaining reaction mechanisms, such as oxidation risks or thermal runaway potentials. For instance, ethanol’s compatibility with nitric acid would be flagged red due to explosive esterification reactions. Modern charts are dynamic: digital versions link to real-time databases updated with new research, while printable charts are posted in labs and storage areas. Understanding symbols like “NR” (not recommended) or “C” (corrosive) is essential for accurate interpretation, turning raw data into life-saving protocols.
Chemistry Behind the Chaos: Why Fluids React
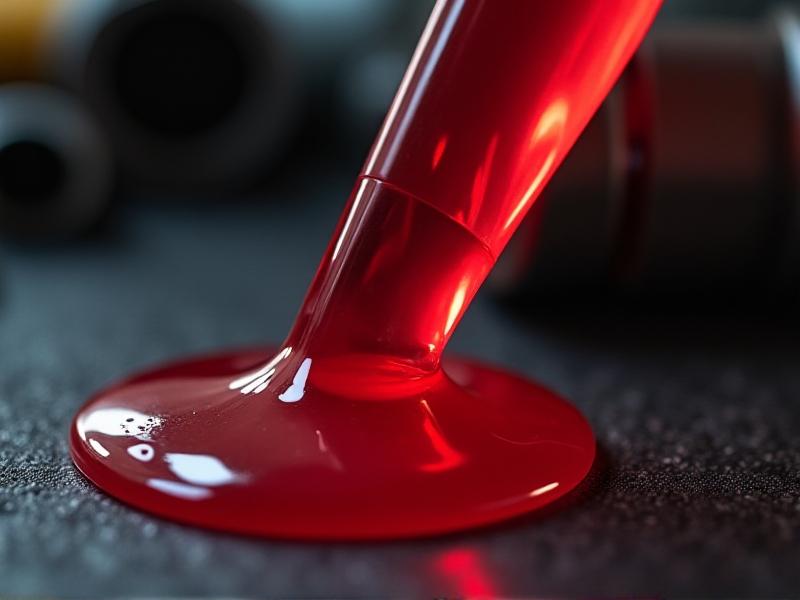
Fluid interactions hinge on molecular behavior. Polar solvents like water readily mix with other polar substances but repel nonpolar oils—a principle leveraged in emulsifiers. Oxidation-reduction reactions, such as chlorine bleach reacting with ammonia to produce toxic chloramine gas, exemplify electron exchange dangers. Temperature plays a role too: storing hydrogen peroxide above 30°C can accelerate decomposition into water and oxygen, destabilizing containers. Even seemingly inert materials like PTFE (Teflon) can degrade when exposed to molten alkali metals. Recognizing these patterns helps teams predict risks beyond the chart’s scope, fostering a culture of proactive hazard assessment rather than reactive problem-solving.
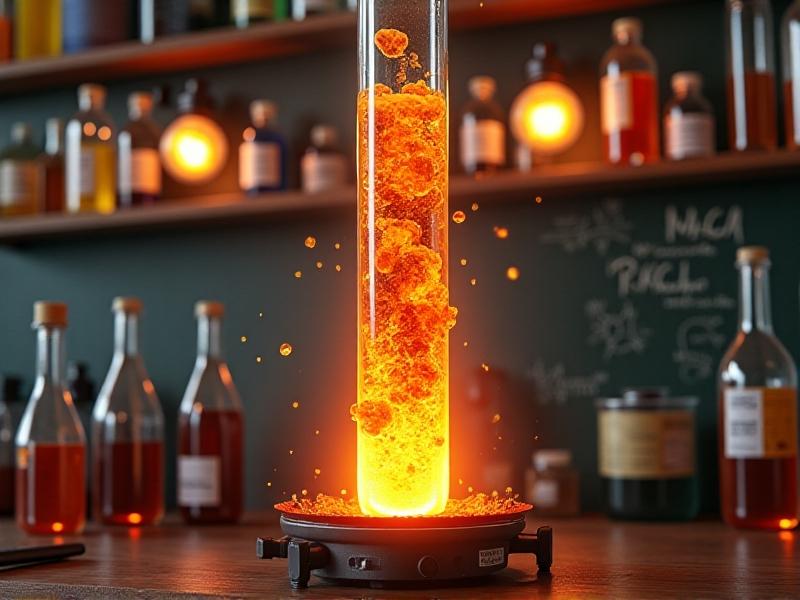
Real-World Consequences of Mixing Incompatible Fluids
In 2019, a European pharmaceutical plant mistakenly mixed sulfuric acid with a sodium hypochlorite solution, releasing chlorine gas that hospitalized 12 workers and halted production for weeks. The root cause? An outdated compatibility chart failed to highlight the interaction. Similarly, a California winery once used a chlorinated cleaner to sanitize stainless steel tanks, not realizing residual chlorine would react with tannins in the wine, creating a foul-tasting compound. These cases underscore the chart’s role as a living document—regular updates and staff training are non-negotiable. Financial repercussions extend beyond cleanup: lawsuits, regulatory fines, and reputational damage can cripple businesses, making prevention far cheaper than mitigation.
Building Your Fluid Compatibility Chart: Step-by-Step

Creating a custom compatibility chart starts with inventorying all fluids onsite, including cleaners, lubricants, and raw materials. Consult safety data sheets (SDS) for reactivity data, and cross-check against databases like CAMEO or NOAA’s reactivity tool. Next, categorize fluids by chemical family—acids, bases, solvents—and map interactions within and between groups. Testing is critical: small-scale lab experiments can reveal undocumented reactions, like a surfactant causing unexpected foaming when mixed with a coolant. Finally, digitize the chart using cloud-based platforms that allow real-time updates and mobile access. For a mid-sized automotive plant, this process might take six weeks but pays dividends in risk reduction and regulatory compliance.
Best Practices for Fluid Handling and Storage
Segregate fluids by compatibility group—never alphabetically. Store oxidizers away from flammables, and acids in dedicated corrosion-resistant cabinets. Use secondary containment trays to catch leaks, and label containers with both product names and risk codes (e.g., “COR” for corrosive). Training should include hands-on drills, like simulating a spill response for nitric acid mixing with organic solvents. Implement a “check-twice” policy where two technicians verify compatibility before transferring fluids. For example, a Texas oil refinery reduced cross-contamination incidents by 80% after introducing barcode scanners that pull compatibility data from their central system during loading procedures.
The Future of Fluid Management: Technology and Innovation
Emerging technologies are revolutionizing fluid compatibility management. AI platforms like ChemLogic predict unknown interactions by analyzing molecular structures, while RFID tags on containers alert workers to proximity risks via smart helmets. In Singapore, a pilot program uses quantum computing to simulate billions of fluid combinations in minutes, identifying previously overlooked risks. Augmented reality (AR) glasses now overlay compatibility data directly onto physical containers, reducing human error during high-pressure tasks. These innovations don’t replace charts—they enhance them, creating adaptive systems where safety evolves alongside chemical innovation.